Leads
Lead Activity . Comments . Meetings . Reminders . Attachments . Add Property . Lead Amount & Commission
Dubai’s real estate sector recorded AED 252 billion in total transaction volume in Q1 2026 — a 31 percent year-on-year increase, according to the Dubai Land Department (DLD). Of this, AED 173 billion represented direct investment value, with the remainder comprising mortgage registrations, gift transfers, and associated transaction fees.
If you own or manage a real estate agency in the UAE, these are the 5 KPIs your business cannot afford to ignore. Tracking the right key performance indicators for real estate agents on your team is not optional — it is the only way to know if your agency is growing or quietly bleeding deals every single month. You probably track commissions. But commissions only tell you what already happened — not what is about to go wrong. By the time you see the problem in your revenue, you have already lost 30 days of deals.
This guide gives you the 5 key real estate KPIs Dubai agency owners use to spot problems before they become revenue losses — with the exact formula, the UAE-specific target number, and one practical action you can implement this week to safeguard your business growth.
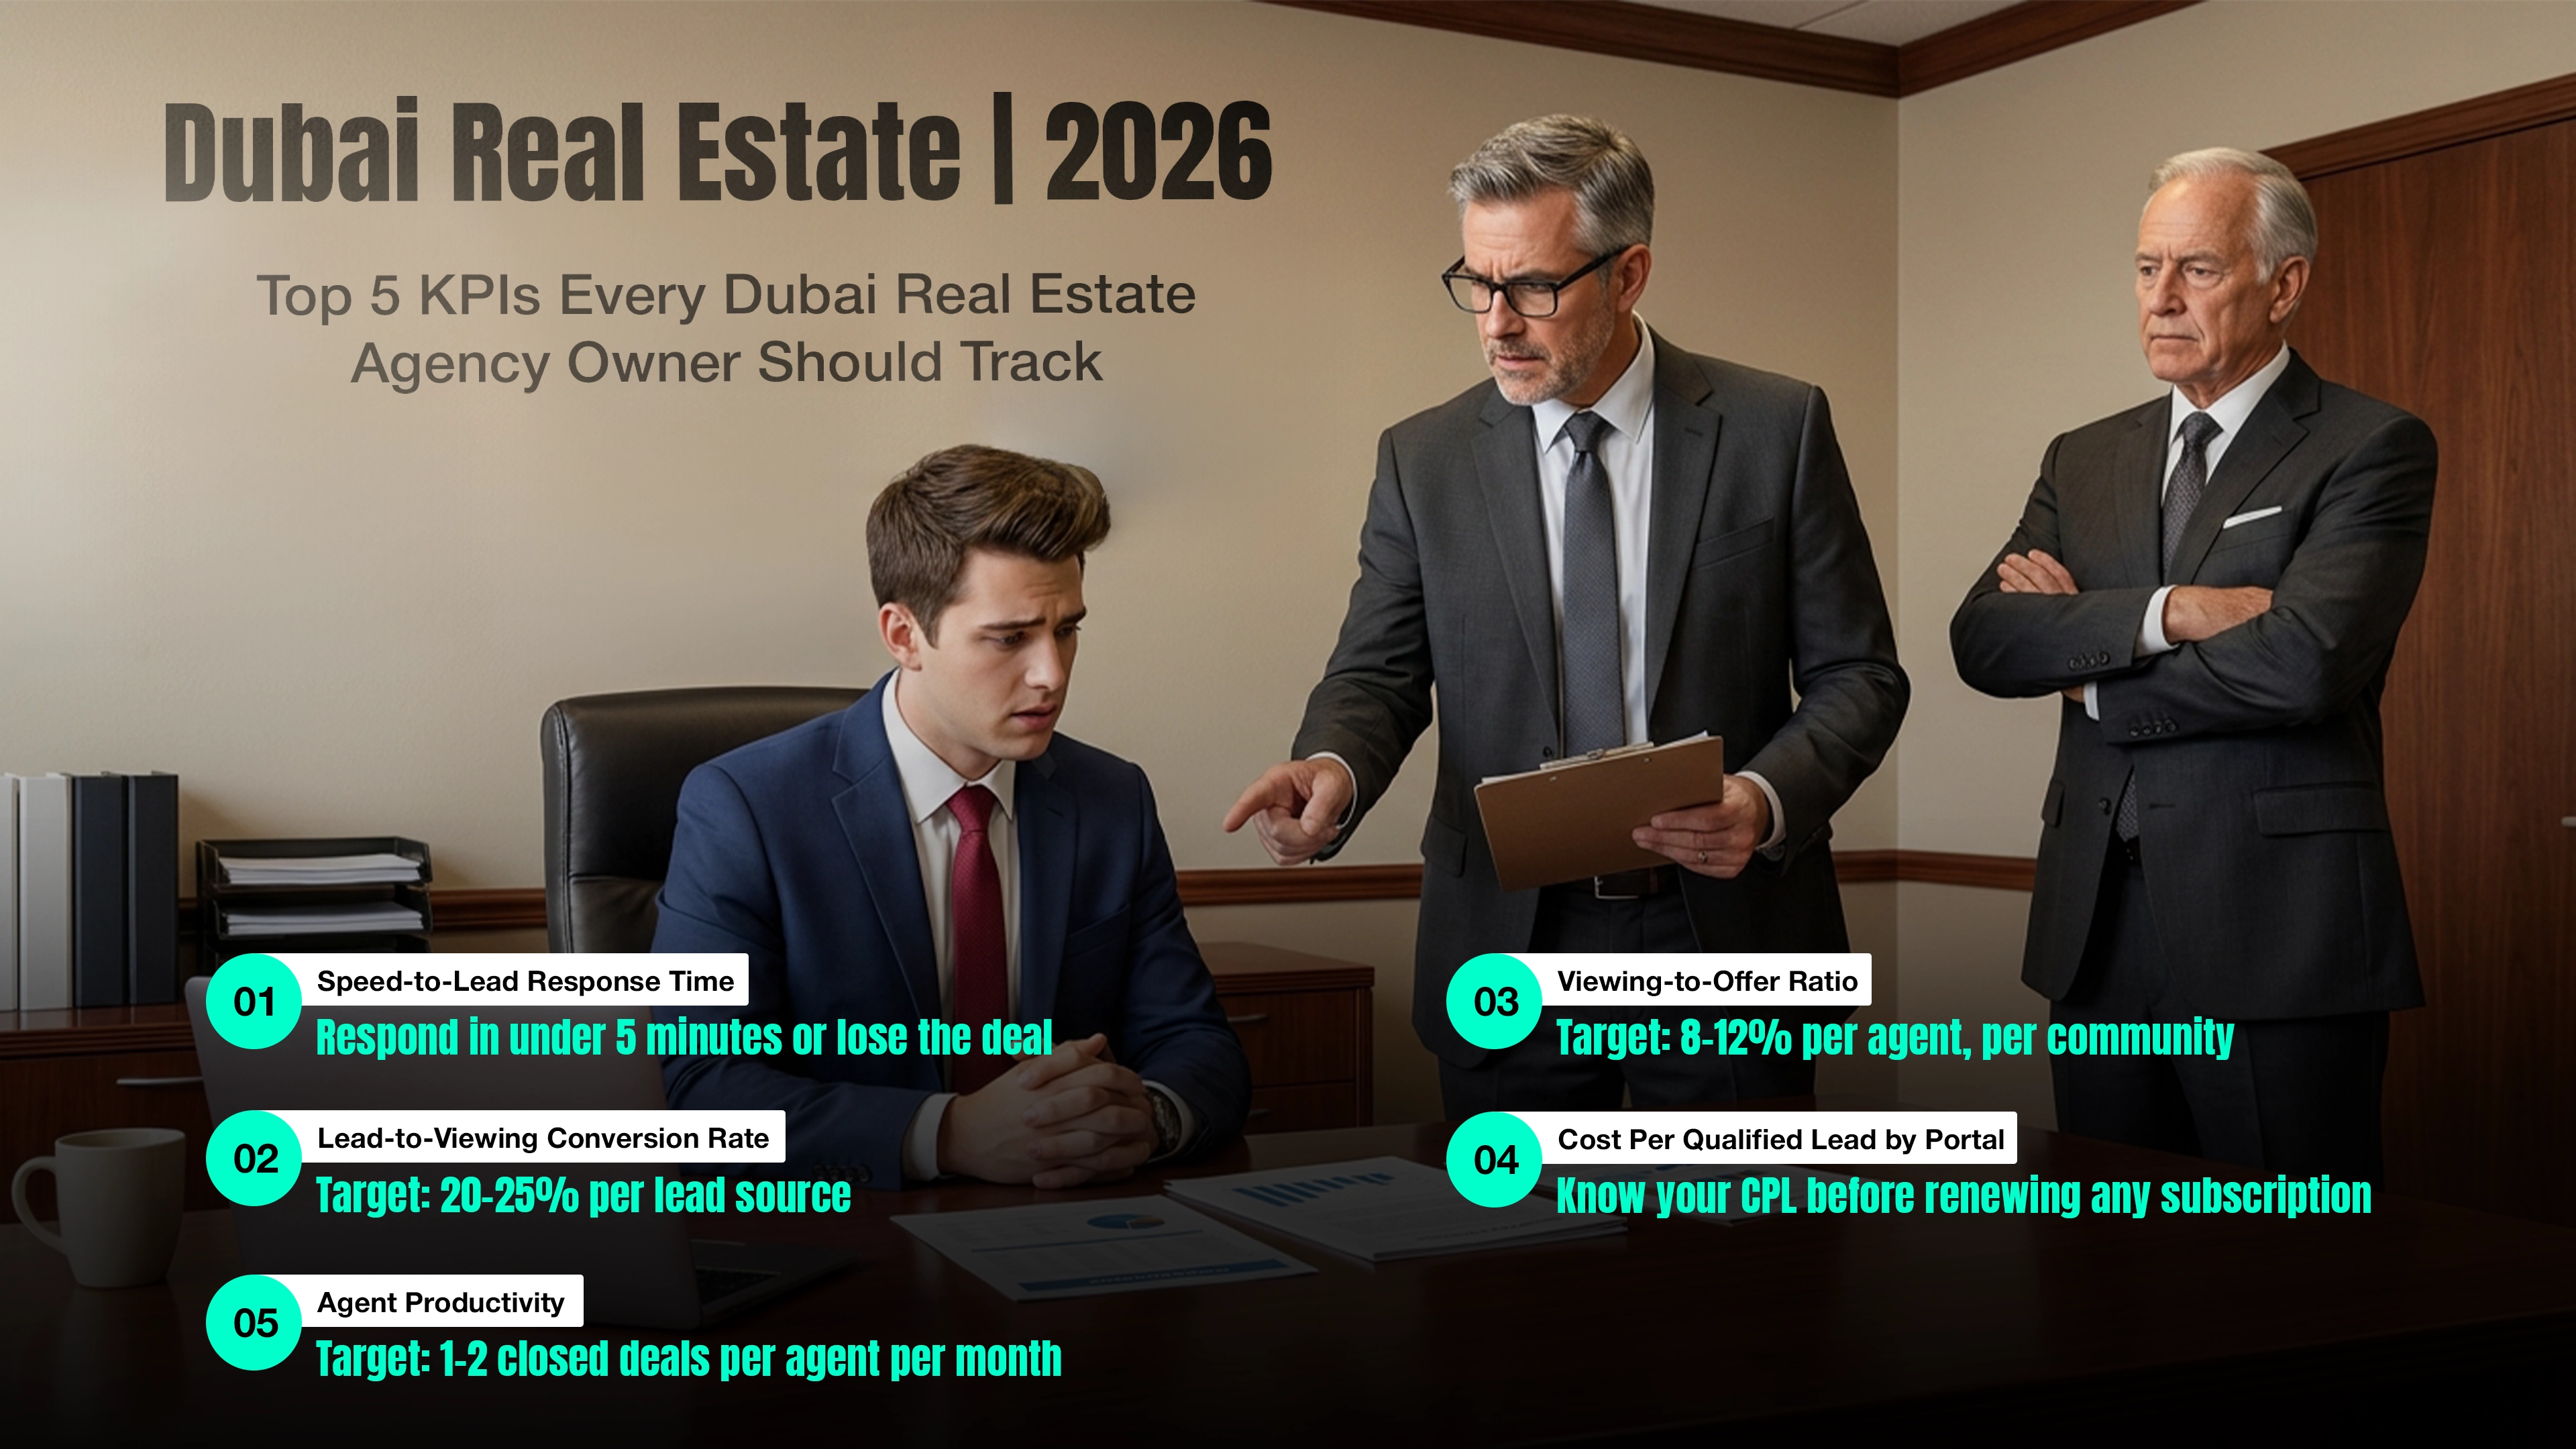
A KPI (Key Performance Indicator) is a metric that indicates whether your agency is moving forward or quietly falling behind. It is not a report you look at when something feels wrong — it is the early signal that tells you what to fix before it costs you a deal.
Individual agents track their own effort. Agency owners track the system. Your KPIs must show you financial performance across your entire team — not just your personal pipeline.
Total leads received is a vanity metric. Lead-to-viewing conversion rate is a real KPI. The right metrics tell you whether your process is working — not just how busy your team is.
A KPI only matters if it changes a decision. If you track a number and nothing changes, you are measuring for comfort — not for growth. The 5 KPIs in this guide are built around decisions: where to spend, who to coach, which deals to chase, and when to stop doing what is not working.
The right 5 KPIs do not just measure your past — they tell you what to fix before next month ends.
Over 60,000 real estate transactions closed in a single quarter in the UAE — and more than 15,000 RERA-licensed active brokers are competing for the same deals across Dubai. Every broker in this market is chasing the same leads, listings, and buyers. Of the AED 252 billion in total transaction volume in Q1 2026, AED 173 billion represented direct investment value — a 22 percent year-on-year rise in direct investment, according to the Dubai Land Department Q1 2026 Market Bulletin. The market doesn’t wait — it rewards agencies that track their numbers.
In the UAE, buyers send the same property inquiry to three to five agencies at once. The agency that responds in five minutes gets the conversation. The one that responds in two hours gets ignored — not occasionally, but consistently. Speed and process decide who wins, not reputation alone.
Off-plan properties account for the majority of transactions in Dubai. Without KPIs specific to off-plan pipelines, you are managing this market without the numbers that matter most. The difference between running your agency and leading your market comes down to five numbers. Here they are.
Speed-to-lead is how fast your agency responds to a new inquiry from the moment it arrives — measured in minutes. It is not about individual agent effort. It is about whether your agency has a system that ensures no lead waits without a reply.
Measure in minutes. Calculate this daily per agent — not monthly. A monthly average hides your worst days and your slowest agents. The problem is always in the daily numbers, not the monthly summary.
Dubai buyers do not wait. They message and move on. If your reply takes 15 minutes, the conversation is likely already happening somewhere else. Responding after 30 minutes does not just reduce your chance — it eliminates it.
Per-agent speed-to-lead tracking turns a blind spot into a manageable variable. One underperforming agent identified and coached early typically recovers within 30 days — and the pipeline impact is immediate. Track it by agent, by time slot, and by lead source.
Fixing a single agent's lead response time often produces the same pipeline impact as adding an entirely new lead source — at zero additional spend. Pair speed-to-lead with follow-up completion rate: what percentage of leads receive at least three follow-ups within seven days. Speed without follow-up is a wasted first impression.
In the UAE, where buyers and investors often evaluate multiple agencies at once, the first professional response wins — not the most experienced agent.
This Week: Open your CRM and filter last month’s leads by response time. Find the three slowest-responding leads. Were they from the same agent? The same time slot? That pattern is your first fix this week.
Log every lead with a timestamp in your CRM from the moment it arrives. Track the gap between arrival and first reply per agent every day. Set automated notifications so no lead goes unassigned for more than five minutes.
Your CRM should auto-assign leads the moment they arrive, capture WhatsApp inquiries directly, and log response times per agent without manual input. Review this number every Monday morning as part of your weekly KPI session.
You cannot fix the response time you are not measuring.
Lead-to-Viewing Conversion Rate is the percentage of incoming leads that result in a scheduled property viewing. It is the first real conversion point in your pipeline — the moment a lead becomes an active prospect rather than a name in a database.
Track this weekly per lead source — not monthly. Monthly tracking is too slow for the UAE market. By the time you see a problem in monthly data, you have already lost three to four weeks of pipeline activity.
Break this down by portal. Your Property Finder leads may convert at 25 percent. Your Facebook leads may convert at 8 percent. Same budget — very different results. Track by source every week, not combined.
You probably buy more leads when this number drops. The real problem is rarely lead volume — it is lead-to-viewing efficiency. If 100 leads arrive and only 8 become viewings, spending more on ads will not fix a broken funnel. A Property Finder lead and a Facebook lead behave entirely differently — averaging them together makes both invisible. Track lead-to-viewing by source, not as one combined total.
A low rate here signals that buyer — often overseas investors making decisions remotely — are not receiving the level of response and qualification that prompts them to commit to a viewing. Without this ratio tracked by source and by agent, you will keep solving the wrong problem.
Without this number tracked weekly, you will keep spending on the wrong channels and qualifying the wrong leads for months before the revenue impact becomes visible.
This Week: Pick your two highest-spend lead sources from last month. Calculate the lead-to-viewing rate for each separately. If the gap between them exceeds 8 percentage points, you have a channel reallocation decision to make this week.
Set up pipeline stages in your CRM: Lead Received, Qualified, Viewing Booked, Offer Made, Closed. Every lead moves through these stages and is tagged by source from day one — Bayut, Property Finder, Dubizzle, Facebook, Google Ads, walk-in, or referral.
Your CRM should auto-tag every lead source from day one and display funnel stages in a single view — so the data is always there when you need to make a channel decision.
Portal spends without lead-to-viewing data is guesswork.
Viewing-to-Offer Ratio is the percentage of property viewings that result in a formal offer. It tells you whether your agents are matching the right buyers to the right properties — or just filling calendars with viewings that go nowhere and waste everyone’s time.
Calculate this monthly per agent and per community. A Downtown Dubai conversion timeline looks very different from a Jumeirah Village Circle (JVC) one — track each area separately, not as a single combined number.
Track Days to Offer alongside this ratio — the average number of days from a first viewing to the receipt of an offer. Dubai target: 7 to 14 days for ready properties only. Note: this metric applies to ready property transactions. For off-plan sales, use Presentation-to-Booking Rate — covered in the Bonus KPIs section below. Community matters. Downtown Dubai and Dubai Marina tend to see faster offer timelines than emerging communities. Track this ratio by area — not just overall. A low overall number may hide a strong community alongside a weak one in your pipeline.
A low viewing-to-offer ratio tells you exactly what is going wrong — and it is one of three things: your pricing is off, your agents are not presenting well, or your buyers are not matched to the right properties. As an agency owner, you can identify this by agent: one agent may convert 20 percent of viewings to offers, another 4 percent. That gap reveals a training need, a pricing issue, or a matching problem — not bad luck.
A viewing with no offer is not a neutral event. It is a cost: agent time, travel, and a buyer who is now talking to a competitor. In Dubai specifically, a buyer who views a property and does not offer within 14 days has usually already moved on. Without tracking this by agent and by community, you will not know which part of your process is breaking down.
Without tracking this ratio, you are measuring effort — not results. Effort does not pay the agency’s bills. Offers do.
This Week: Ask your three most experienced agents one question: What is the most common reason a buyer views but does not offer? Their answers tell you whether the problem is pricing, property matching, or presentation — each requires a different fix.
Log every viewing and every offer in your CRM with dates. Tag each record by agent, by community, and by property type. Review monthly — if the ratio drops below 8 percent for any agent, investigate the cause: price, presentation, or buyer qualification.
Your CRM should log every viewing and offer by agent, community, and property type — so you can see exactly where the ratio breaks down and why.
A low ratio is not bad luck — it is information. Use it.
Cost Per Qualified Lead (CPL) is how much your agency spends to acquire one genuinely interested lead from each marketing channel — Property Finder, Bayut, Dubizzle, Google Ads, Meta, and any other source you pay for. A qualified lead has progressed to at least one viewing or a meaningful conversation — not just a phone number collected from an ad.
Calculate this at the end of each month for each channel. Pause any channel that is consistently above your target CPL and not delivering leads that convert to viewings. Never let a channel run for three months without checking its CPL against its lead-to-viewing rate.
CPL tells you the input cost. Cost Per Closed Deal (CPCD) tells you the actual return. To calculate CPCD: divide total channel spend by the number of deals closed that originated from that channel. A Google Ads campaign at AED 900 CPL that closes three deals per month may outperform a Facebook campaign at AED 80 CPL that closes one. Always track both: CPL flags budget waste at the top of the funnel. CPCD confirms whether that funnel is worth running at all.
Dubai agency owners spend thousands of dirhams monthly on portals and ad campaigns without knowing which source delivers the most qualified leads at the best cost. Two agencies can run the same budget. One gets 200 low-quality leads. The other gets 40 high-quality leads. The second agency closes more deals and spends less per deal closed.
Two agencies running the same AED 15,000 monthly portal budget will produce entirely different results — the difference lies in which channel each dirham is actually working in. Track CPL alongside lead-to-viewing rate together — never one without the other.
In the UAE, portals like Property Finder, Bayut, and Dubizzle dominate lead generation. Knowing which one gives your agency the best return per dirham spent is a core business decision — not a marketing preference.
Without portal lead tracking, you are renewing subscriptions out of habit — and that is the easiest budget leak to fix, yet most agencies leave it unchecked for 12 months.
This Week: Before calculating your actual CPL per channel, write down what you believe it is. Then run the real number. The gap between your assumption and reality is your current budget leak — and in most agencies, it is larger than expected.
Tag every lead source in your CRM from day one — portal name, campaign name, and ad type. Do not group sources. Every channel needs its own line so you can see exactly where each dirham goes and what it returns. Redirect your spend based on what the numbers show, not what you assume.
The cheapest lead is the one that closes — not the one that costs least.
Agent Productivity measures how many deals each agent closes per month or quarter, and what revenue those deals generate for your agency. It is the output KPI that every brokerage owner needs — and the one most do not track per agent until something goes wrong and the revenue drop makes it impossible to ignore.
Pair this with: Average Commission Per Agent = Total Commission Revenue ÷ Number of Active Agents.
Volume alone does not tell the full story. An agent closing 10 low-value rentals may generate less revenue than one closing two high-value sales. Track both numbers side by side every month — deals per agent and commission per agent together.
Track alongside micro-market data — which community gives your agency the highest deal close rate? Focus your listing strategy on that area and build from there.
You cannot scale effectively by adding more agents if per-agent output is low. In a competitive Dubai market, productivity per agent—not headcount—makes the difference.
For example, a team closing 20 deals per month may seem strong, but if two agents are responsible for most of the deals, the rest are underperforming. Track input KPIs like calls made, leads contacted, and viewings booked, alongside output KPIs.
High inputs with low deals indicate conversion issues; low inputs indicate effort or process issues. Tracking per-agent numbers moves your agency from gut-based management to fact-based accountability. Use a leaderboard or individual coaching depending on performance gaps, and monitor which approach improves your lowest performers.
This Week: Book a 15-minute conversation — not a performance review — with your lowest-producing agent this week. Ask one question: What is the biggest thing slowing you down right now? The answer is rarely effort. The gap between your top and bottom performers is almost always a process or pipeline problem — and it has been sitting in your data the whole time.
Tag every closed deal to the responsible agent in your CRM from day one. Review monthly — deals closed, viewings conducted, and leads contacted per agent, side by side in one view.
Set monthly targets per agent and a quarterly brokerage total. Review all agent numbers every Monday — so you always know where your agency is gaining ground and where it is not.
Headcount without output tracking is not growth — it is overhead.
Most UAE agencies track these numbers across 4 or 5 separate tools — WhatsApp, spreadsheets, portal dashboards, a basic CRM, and gut feeling. When your data is scattered across tools, you see the problem 30 to 45 days too late to stop it from affecting your revenue.
By the time your monthly commission report drops, the signal was already there six weeks earlier in your lead-to-viewing rate. Scattered data makes that signal invisible until it becomes expensive. One connected system changes that — giving you the benchmarking data to compare week-on-week, month-on-month, and year-on-year.
Here is what one system should track across all 5 KPIs:
Your pipeline view should show every active lead at a glance — you know which deals are stuck, which are moving, and which need attention today. No switching between platforms. No manual exports. No data that is three days old by the time you look at it.
Different KPIs require different review frequencies.
Compare the same month year-on-year. If your lead-to-viewing rate was 22 percent last April and is 14 percent this April, something broke in the last 12 months — and now you know exactly where to look. A single KPI number means nothing on its own. The direction it is moving in tells you everything.
The goal is one system, one view, and one Monday session — where every number is already there when you need it.
The 5 KPIs above cover your pipeline from lead to close. These 4 cover what happens before and after — and they are the ones you are most likely skipping right now.
Aftercare and Referral Rate is the percentage of past clients who refer new clients to your agency within 12 months of deal closure.
UAE target: 15 to 20 percent referral rate in high-performing agencies. Below 10 percent means your aftercare process needs work. Referrals cost nothing in CPL and convert faster than any paid lead. In the UAE's relationship-driven property market, client retention starts after the deal closes — not before.
Also track Client Satisfaction Score alongside referral rate — collect a post-deal rating from every client. Target 4.5 out of 5 or above. A simple WhatsApp message after handover, asking for feedback, is enough to start building this data. Log every incoming lead as Referral, Portal, or Organic from day one — your CRM should handle this automatically without manual counting.
Most agencies invest everything in winning the deal and almost nothing in what comes after. That imbalance is where referral pipelines quietly dry up — and where the easiest revenue your agency will ever generate is being left on the table.
Off-Plan Booking Rate is the percentage of off-plan project inquiries that result in a confirmed booking.
Off-plan properties account for a significant share of Dubai transactions. A dedicated off-plan booking rate tells you which projects your agents sell best and where they need more product knowledge or pricing clarity. Track by project and by developer — not just overall. One project may have a 30 percent booking rate, while another sits at 5 percent, with the same agent presenting both.
Your agents should have access to current unit availability, payment plans, floor plans, and pricing before every presentation. When they walk in prepared, booking rates go up.
Listing Quality Score is an internal score measuring whether each of your agency’s listings meets a defined quality standard before it goes live.
Score each listing using a compliance-first framework. Verified owner documents (Form A signed, title deed confirmed): MANDATORY — listing cannot go live without this, regardless of other scores. Then score out of 5: professional photos (2 points), accurate price vs current market comparable (2 points), complete property description (1 point), video or 360-degree tour (1 bonus point). Minimum to publish: 4 out of 5 scoring points, with verified owner documentation completed. Target: a minimum of 4 out of 5 per listing. Apply this checklist before any listing goes live.
Poor listing quality generates poor-quality inquiries. Buyers decide whether to inquire based on photos and listing accuracy before any conversation begins. Also track average days on market per listing alongside this score — a well-priced residential listing in the UAE should move within 30 to 45 days. A run of 60 days or more consistently signals a pricing or presentation problem — both are fixable with the right data.
Every listing should be presented with verified project data, professional layout, and accurate pricing — ready to share with clients the moment they inquire.
Appointment-to-Listing Conversion Rate is the percentage of meetings with property owners that result in your agency receiving a signed Form A (RERA seller mandate) for sale listings, or a signed Form B (RERA tenancy mandate) for rental listings.
UAE target: 40 to 60 percent is strong for experienced agents. A score below 30 percent means your pitch, market data presentation, or trust-building process needs work. This is the only seller-side KPI in this guide — and the one most agency skip until their listing count drops, and they cannot figure out why.
Every landlord and developer in Dubai meet with multiple agencies before choosing one. The agency that walks in with accurate market data, a clear pricing strategy, and a professional presentation wins the listing. Log every owner meeting in your CRM, including the outcome — whether a listing was secured or not. Review monthly per agent. If any agent falls below 30 percent for two consecutive months, sit in on their next owner meeting and find out what is going wrong.
A healthy lead-to-sale conversion rate in Dubai is 3 to 5 percent. For lead-to-viewing specifically, target 20 to 25 percent. A lead-to-viewing rate below 15 percent indicates your qualification process or follow-up system needs attention. If you are below both numbers, fix your lead-to-viewing rate first — that is where the breakdown starts, and fixing it upstream improves every number that follows.
Within 5 minutes. Dubai buyers’ message multiple agencies simultaneously. The first agent with a relevant, professional reply almost always wins the conversation. After 30 minutes, the chance of meaningful engagement drops sharply. If your agency does not have a system to assign and respond in under 5 minutes, you are losing deals before the conversation starts — every single day.
The view-to-offer ratio is the percentage of property viewings that result in a formal offer. In Dubai, the typical range for residential properties is 8 to 12 percent. Above 15 percent means your agents are qualifying buyers well before the viewing. A rate below 8 percent usually indicates a pricing, matching, or presentation issue — not a lead volume problem. Fix the ratio before spending more on marketing.
For off-plan, focus on Speed-to-Lead — off-plan buyers decide fast and shop multiple agencies at once. Track Off-Plan Booking Rate per project and per developer. Track CPL by portal because off-plan leads from Facebook and Google Ads behave very differently from Property Finder or Bayut leads. For off-plan specifically, your team needs a system that tracks unit availability, payment plans, and bookings across active projects in real time.
5 to 7 is the right range. Tracking too many numbers dilutes focus and creates reporting without decisions. Start with the 5 in this guide. Add Off-Plan Booking Rate and Referral Rate as your agency grows. Review all of them every Monday in a 15-minute session — not when something feels wrong, but every single week, so problems surface early.
The fastest fix is removing the manual step. CRMs built for UAE real estate auto-capture WhatsApp inquiries, auto-log portal leads, and auto-assign response timestamps without any agent input.
For data that still requires manual entry — viewing notes, offer amounts, closing reasons — create a single rule: if it is not logged by the end of the day, it does not count toward the agent's tracked performance numbers. The right system should handle all of this automatically — portal integrations, WhatsApp lead capture, and team-tracking in one place.
40 to 60 percent is strong for experienced agents. This means if you hold 10 owner meetings, 4 to 6 should result in a signed Form A (RERA seller mandate) for sales, or a signed Form B for rentals. A score below 30 percent means your pitch, pricing discussion, or market data presentation needs work. This is the seller-side KPI most agencies ignore — but without strong listings, every other KPI in this guide becomes harder to hit.
Speed-to-lead is how fast you respond to a new inquiry — measured in minutes from the moment it arrives in your system. Follow-up rate is how consistently your team contacts leads that did not convert on the first reply — measured as the percentage of leads receiving three or more contacts within seven days. Speed wins the first conversation. Follow-up wins the deal. You need to track both separately to know which one is failing.
These are the questions you are most likely asking about real estate KPIs — answered directly.
Your agency’s growth in the UAE does not come from tracking 50 numbers. It comes from consistently tracking the right five every single week, without exception.
Individual agents track effort. Agency owners track systems. These 5 real estate KPIs are how you turn daily effort into a system that grows without you having to chase every deal yourself. Dubai’s market in 2026 is moving faster than ever. The agencies that build these tracking habits now compound their advantage with each subsequent quarter.
The agencies that scale in Dubai are not the ones with the most agents or the biggest ad budgets — they are the ones that know their numbers every single week and act on them before the problem reaches their revenue.


